
Top 10, 20, 50 Most polluted state in India : According to the World Air Quality Report 2025 (published in March 2026), India stands licensed as the world’s 6th most polluted nation. Although list of “Top 50”, including all the 28 states and 8 UTs is not published rank-wise, however non-attainment cities($PM_{2.5}$ annual average), can create a rough grouping across most-affected regions.
Top 10 Most Polluted States/UTs (2025–26)
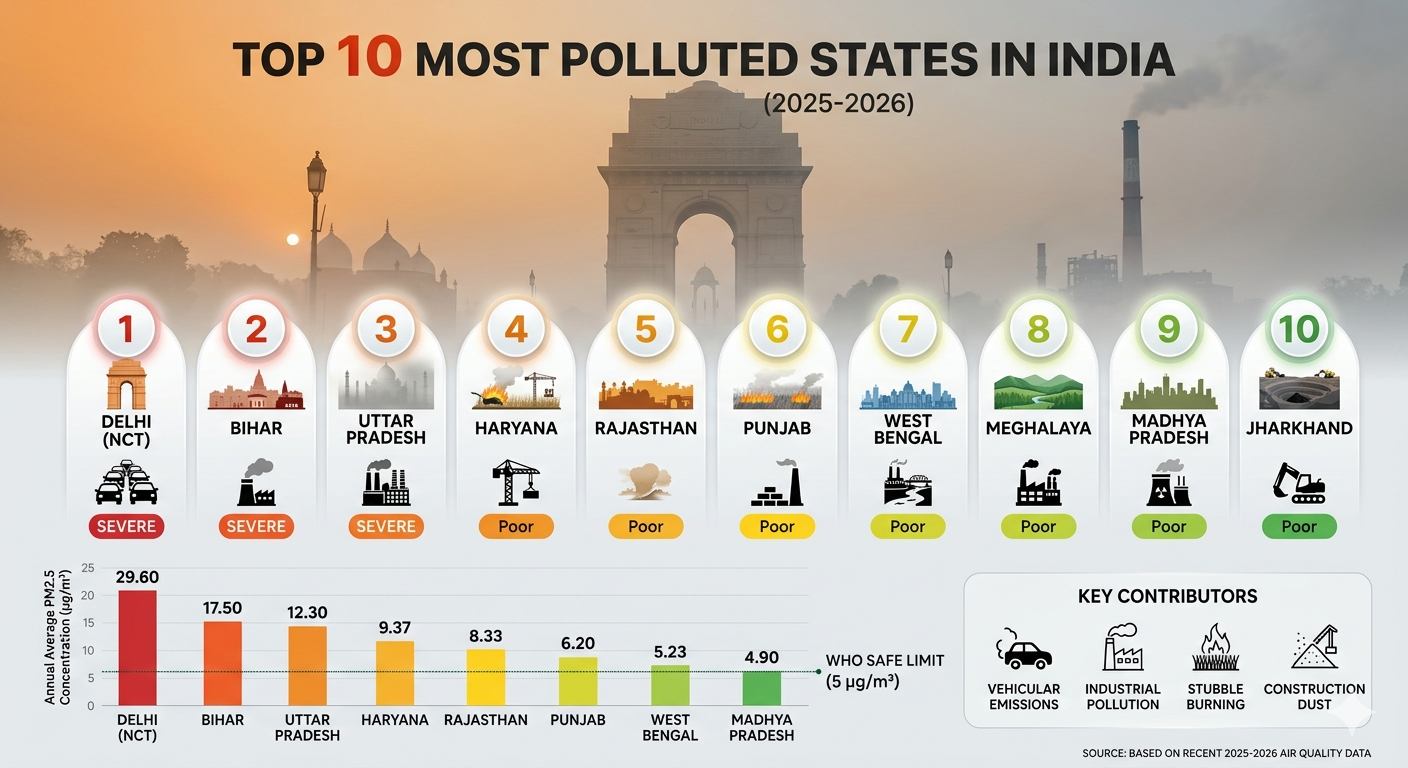
The “Top 10” is dominated by the Indo-Gangetic Plain, where geography and industrial activity trap pollutants.
| Rank | State / Union Territory | Key Pollution Hotspots |
| 1 | Delhi (NCT) | Ranked as the world’s most polluted capital for the 8th year. |
| 2 | Bihar | Largest number of cities (21/24) exceeding safety limits. |
| 3 | Uttar Pradesh | Home to Loni, currently the most polluted city in the world. |
| 4 | Haryana | Significant spikes in Dharuhera, Gurgaon, and Faridabad. |
| 5 | Rajasthan | High levels in Bhiwadi and industrial zones near NCR. |
| 6 | Meghalaya | High industrial impact; Byrnihat is a top-3 polluted city. |
| 7 | West Bengal | Significant urban pollution in Kolkata and Ula (Birnagar). |
| 8 | Jharkhand | Coal mining belts in Dhanbad and Jharia remain severe. |
| 9 | Punjab | Seasonal spikes in Mandi Gobindgarh and Ludhiana. |
| 10 | Chandigarh (UT) | Consistently records “Poor” to “Very Poor” winter AQI. |

Extended Rankings (Top 11–20)
These states have seen rising pollution levels due to rapid industrialization and urban expansion.
-
11. Madhya Pradesh: (Hotspots: Gwalior, Singrauli)
-
12. Himachal Pradesh: (Industrial zones like Baddi)
-
13. Gujarat: (Industrial hubs like Ahmedabad and Surat)
-
14. Maharashtra: (Construction dust in Mumbai and Navi Mumbai)
-
15. Odisha: (Mining regions like Talcher)
-
16. Assam: (Guwahati and industrial border towns)
-
17. Chhattisgarh: (Raipur and Bhilai)
-
18. Telangana: (Hyderabad’s rising vehicular emissions)
-
19. Karnataka: (Bengaluru’s urban sprawl, though overall better than North India)
-
20. Tamil Nadu: (Chennai and industrial clusters like Coimbatore)

Top 50 Most Polluted Cities in India
| Rank | State / Union Territory | Avg. PM2.5 (µg/m³) | Pollution Category | Key Polluted City |
| 1 | Delhi (NCT) | 99.6 | Severe | New Delhi |
| 2 | Bihar | 92.4 | Severe | Patna / Hajipur |
| 3 | Uttar Pradesh | 88.5 | Severe | Loni / Ghaziabad |
| 4 | Haryana | 81.2 | Very Poor | Faridabad / Gurgaon |
| 5 | Rajasthan | 74.8 | Very Poor | Bhiwadi |
| 6 | Punjab | 68.3 | Poor | Mandi Gobindgarh |
| 7 | West Bengal | 62.1 | Poor | Kolkata / Birnagar |
| 8 | Meghalaya | 59.4 | Poor | Byrnihat |
| 9 | Madhya Pradesh | 56.7 | Poor | Gwalior / Singrauli |
| 10 | Jharkhand | 53.2 | Poor | Dhanbad |
| 11 | Chandigarh (UT) | 51.5 | Poor | Chandigarh |
| 12 | Maharashtra | 48.9 | Moderate | Mumbai / Nagpur |
| 13 | Gujarat | 45.6 | Moderate | Ahmedabad |
| 14 | Telangana | 41.2 | Moderate | Hyderabad |
| 15 | Odisha | 39.8 | Moderate | Angul / Talcher |
| 16 | Himachal Pradesh | 38.5 | Moderate | Baddi |
| 17 | Uttarakhand | 36.4 | Moderate | Kashipur |
| 18 | Andhra Pradesh | 34.2 | Moderate | Visakhapatnam |
| 19 | Chhattisgarh | 32.7 | Moderate | Raipur |
| 20 | Jammu & Kashmir (UT) | 31.5 | Moderate | Srinagar |
| 21 | Tamil Nadu | 30.1 | Satisfactory | Chennai |
| 22 | Karnataka | 28.5 | Satisfactory | Bengaluru |
| 23 | Assam | 27.2 | Satisfactory | Guwahati |
| 24 | Kerala | 24.8 | Satisfactory | Kochi |
| 25 | Tripura | 22.1 | Satisfactory | Agartala |
| 26 | Puducherry (UT) | 21.4 | Satisfactory | Puducherry |
| 27 | Nagaland | 19.5 | Satisfactory | Kohima |
| 28 | Goa | 18.2 | Satisfactory | Panaji |
| 29 | Manipur | 17.5 | Satisfactory | Imphal |
| 30 | Mizoram | 16.2 | Good | Aizawl |
| 31 | Arunachal Pradesh | 15.8 | Good | Itanagar |
| 32 | Sikkim | 14.2 | Good | Gangtok |
| 33 | Ladakh (UT) | 12.5 | Good | Leh |
| 34 | Andaman & Nicobar (UT) | 11.8 | Good | Port Blair |
| 35 | Lakshadweep (UT) | 10.4 | Good | Kavaratti |
| 36 | D&N Haveli & Daman & Diu | 10.1 | Good | Daman |
Key Pollution Drivers
Local Contributors: The Indo-Gangetic plain functions like a pollution bowl, trapping pollutants in winter months.
● (Key Sources): PM2 is primarily driven by vehicles, heavy industrial activity, coal-fired power plants, and construction dust. 5 and PM10 levels.
Seasonal spike: Stubble burning in autumn and cold weather result in sharp increases in the AQI, sometimes pushing it into the hazardous range.
Note on Data: Air quality varies dramatically by season. The “Most Polluted” rank is determined by annual averages, but Punjab and Haryana, for instance, can shoot to the very top all the way up to November during stubble-burning months.

